
Addressing the main challenges of SFDR entity-level PAI reporting
On June 30th, the Sustainable Finance Disclosure Regulation (SFDR) entity reporting period concluded, marking the first deadline for applicable Financial Market Participants (FMPs) (1) to release their Principal Adverse Impact (PAI) statements, so-called entity-level PAI reports (2).
A PAI, as defined within SFDR, is any impact of investment decisions or advice that results in a negative effect on sustainability factors, such as environmental, social, and employee concerns, respect for human rights, anti-corruption, and anti-bribery matters.
In this article, we go over three lessons learned from our analysis of this first regulatory wave, namely:
- Entity-level reporting can provide useful background such as the approach and policies of FMPs related to PAIs, but more actionable information for comparison could come from reporting at product level
- There is still, for some PAIs, no consistent interpretation and application of SFDR methodologies
- Organizations struggle to find data leading to low reporting coverage in some mandatory metrics
We further highlight how tailored data collection campaigns and advanced machine learning models, such as those offered by Clarity AI, can drive more meaningful and trustworthy SFDR entity-level PAI reporting.
Who is subject to reporting?
FMPs with more than 500 employees are obliged to report. The rest are encouraged to report but can decide not to, provided they explain why they “opt-out”, and indicate when they intend to publish this information (3).
What have we observed after the first reporting wave?
At Clarity AI, we have leveraged our AI capabilities together with our sustainability expertise to review a sample of 95 FMPs with Assets Under Management (AuM) above ~20bn (4). We observed that: i) not all asset managers in our sample reported; ii) those that reported had differing abilities to find data for all their assets across all PAIs (% of covered assets); iii) the values of individual PAIs varied drastically across different entities.
Percentage of entities reporting
74% of the largest asset managers in our sample have indeed reported. For the rest, either the report was not published on their website or they stated they were not able to report it this year, usually due to insufficient availability of data. It is worth noting that the European Supervisory Authorities (ESAs) do not consider the absence of data availability a “sufficient justification” for not reporting on PAIs (5).
87% of the FMPs who reported included all mandatory PAIs (6). The rest excluded metrics such as PAI 6 “Total energy consumption intensity,” PAI 8 “Emissions to water,” PAI 9 “Hazardous and radioactive waste,” and in some cases, GHG emissions metrics due to missing data for Scope 3 emissions.
For the reporting of the two additional PAIs (from the list of “optional” ones), there were clear preferences on specific indicators: 70% of FMPs reported on Environmental PAI 4 “Companies without carbon emissions reduction initiatives” and 30% reported on either Social PAI 9 “Lack of Human Rights policy” or 15 “Lack of anti-corruption or anti-bribery policies”.

Figure 1: Total FMPs reporting the PAI entity level report
Note: Data shown for 95 FMPs entity reports (95% have >20 bn AuM or belong to a group of that size). 70 organizations reported, having 87% reporting the complete mandatory PAIs. Source: Clarity AI
Percentage of assets covered
For FMPs reporting, the actual coverage of the portfolio that they were able to assess varied dramatically per PAI. We observe ranges of ~80% for mandatory PAI 10 “Violations of UNGC principles or OECD Guidelines” and PAI 14 “Exposure to controversial weapons,” to less than 25% for PAI 8 “Emissions to water” and PAI 12 “Unadjusted gender pay gap.”
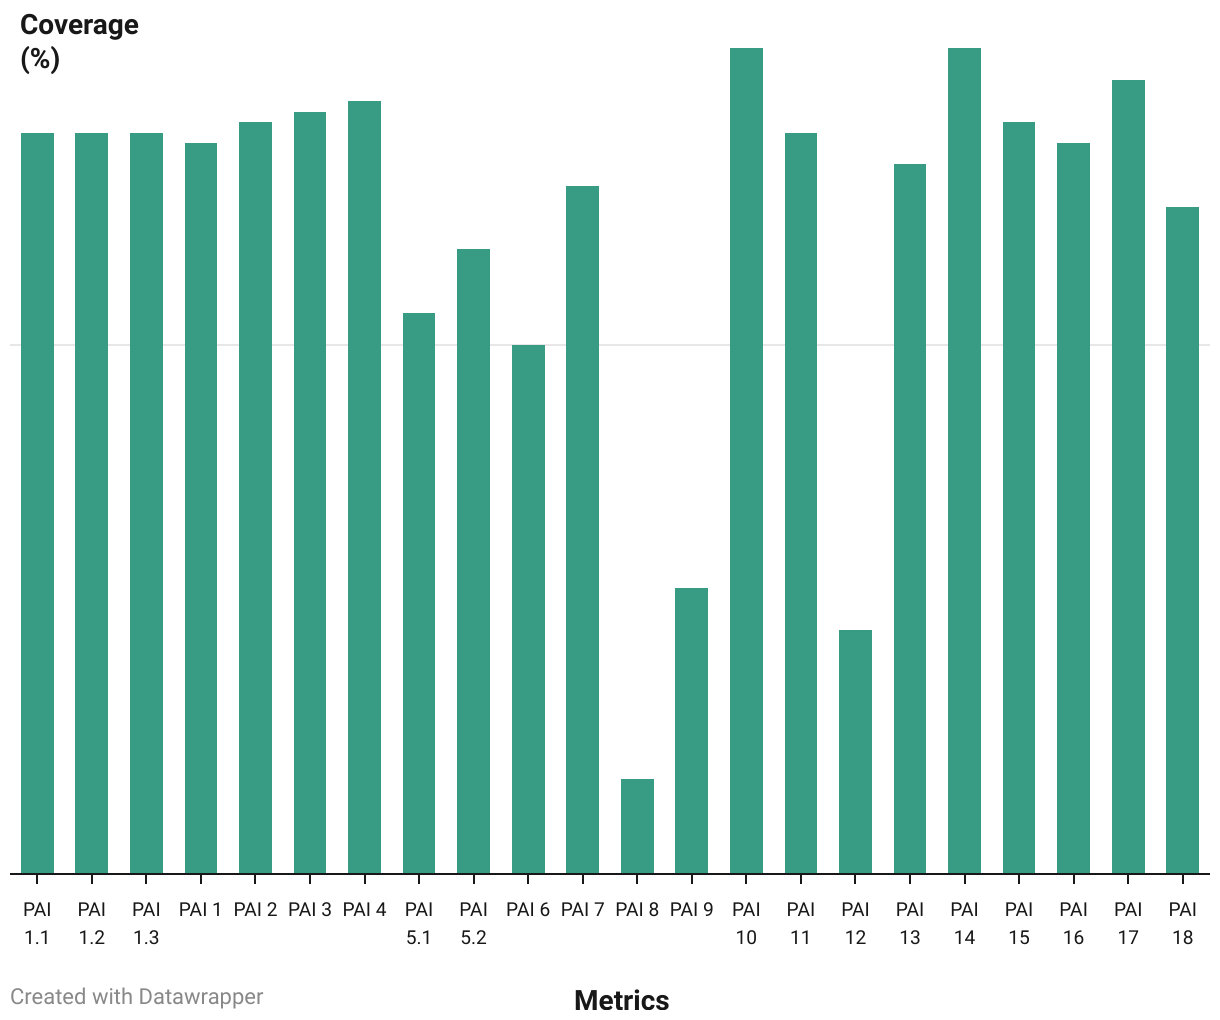
Figure 2: Average percentage of assets covered in mandatory PAIs assessment
Note: Data shown for 40 FMPs reporting percentage of assets covered when calculating the mandatory PAIs. Available reported coverage varied across metrics. Source: Clarity AI
Data Dispersion
For those reporting, we observe a high dispersion of results per PAI (7). These dispersions may be due to different investment strategies being employed by different asset managers which means they are exposed to different industries. Other reasons for these dispersions could also include differing interpretations of the methodologies by FMPs or issues with reported data from companies.
Amongst the PAIs for which we observe greater dispersion, we have the following four:
PAI 6 “Total Energy Consumption Intensity”
It is being reported at PAI and/or sub-PAI level depending on the FMP, higher variation can be found in specific sub-PAIs such as Sector C: Manufacturing. Differences could come from the perimeter used to measure the energy consumed (remember it should apply only to high-impact sectors) or from the base used to normalize (total revenues vs. high-impact sectors revenues).

![]()
Figure 3: Data distribution for PAI 6 “Total energy consumption intensity” (GWh/M€ revenue)
Note: Representation of mandatory PAI 6 data distribution, including data for 24 FMPs which reported an aggregated metric. Rest of FMPs reported at sub-PAI level only, with a similar dispersion at each sub-PAI. Source: Clarity AI
PAI 8 Water Emissions Metric
Regulatory definition excludes some water pollutants e.g. “total salts”. Opposite to pollutants including heavy metals, the total tons released to water from the first pollutant can be higher than the latter by orders of magnitude, having a great impact if accounted for.

![]()
Figure 4: Data distribution for PAI 8 “Emissions to water” (tons/M€ invested)
Note: Representation of mandatory PAI 8 data distribution, including data for 62 FMPs. Source: Clarity AI
PAI 9 Hazardous and Radioactive Waste Metric
For some sectors, there are types of waste generated in high quantities (e.g. waste rock) that can be partially hazardous, even when this is not clearly disclosed. Categorization for these types of waste can vary among participants.

![]()
Figure 5: Data distribution for PAI 9 “Hazardous and radioactive waste” (tons/M€ invested)
Note: Representation of mandatory PAI 8 data distribution, including data for 63 FMPs. Source: Clarity AI
PAI 10 Violations of UNGC principles and OECD Guidelines
The values for this metric remain below ~2.5% for most participants, but there are outliers. The approach to assess this metric varies in the industry in two main dimensions:
- How severe an incident needs to be before being considered a violation
- Which violation categories are included in PAI 10 – some FMPs are excluding categories from the regulatory guidelines (e.g. environmental violations)
Differences in these dimensions could drive dispersion in the reported values.

![]()
Figure 6: Data distribution for PAI 10 “Violations of UNGC principles and OECD guidelines” (%)
Note: Representation of mandatory PAI 10 data distribution, including data for 68 FMPs. Source: Clarity AI
What have we learned?
The first year of PAI entity reporting demonstrates this exercise is far from mature. Still, we have identified three trends that should receive attention in the coming exercises:
- Reporting at entity-level does not provide enough information on the underlying products and may be difficult to interpret for investors. We recommend reporting at product (i.e. fund) level to facilitate understanding of the investment and enhance comparability across products and ultimately help investors choose products that match their own sustainability preferences.
- Investors using different methodologies when reporting the metrics does not allow for clear comparison. Reports show that in many cases there is not a unified approach to measuring impacts, e.g.:
i) Inclusion or exclusion of Scope 3 for GHG emissions (PAIs 1-3);
ii) the potential accounting of Water Pollutants components (for PAI 8) out of the regulatory definition scope;
iii) not consideration the applicability of certain companies / industries to given metrics such as PAI 5 – Renewable Energy Production or PAI 6 – Total Energy Consumption Intensity
The above examples demonstrate the importance of using consistent regulatory guidelines to ensure higher comparability between FMPs. In this vein, we await and welcome the ESAs publication of its review of the RTS under SFDR.
- Lack of data availability will lead to low coverage when reporting for certain PAIs which in turn might lead to non-representative results. Encouraging organizations’ disclosure of ‘standard’ metrics to prevent low coverage is key to assessing objectively specific PAIs. We note that the European Sustainability Reporting Standards under CSRD will help in this regard, but gaps will remain. In that case, leveraging the use of advanced estimation models can mitigate these coverage gaps and provide a more representative assessment.
At Clarity AI we have created SFDR PAI metric methodologies from first principles, analyzing in detail each metric regulatory definition. We have developed tailored data collection campaigns and advanced machine learning models to account for the regulatory nuances mentioned above, such as the inclusion of the appropriate water pollutants in PAI 8 and the correct hazardous waste components in PAI 9. We are looking forward to the updated SFDR RTS expected by the end of this year and expect that some of the challenges described above will be addressed.
(1) FMP is defined in SFDR regulation Article 2(1) and includes asset managers, insurers and pension providers
(2) See annex 1 here
(3) See e.g. paragraph 17 here
(4) 95% of the FMPs analyzed have >20 bn AuM or belong to a group of that size
(5) See paragraph 29 here
(6) We consider applicable mandatory PAIs for companies / sovereigns, excluding real estate metrics due to lower applicability in portfolios
(7) Specific outliers were not considered to prevent potential errors in reporting affecting the analysis


