An Interview Series with Clarity AI Executive Team on the 8 Dimensions of Data Quality
How does Clarity AI ensure its data is of the highest quality?
Clarity AI uses an 8-dimension framework to ensure data is of the highest quality. Those dimensions are coverage, freshness / timeliness, accuracy, data updates, explainability, consistency, point-in-time, and feedback. In this series of interviews with Clarity AI executives, each of these dimensions is explored and explained. Clarity AI’s expert team creates scientific- and evidence-based methodologies that then leverage powerful, scalable artificial intelligence (e.g., machine learning) to collect, clean, analyze and expand existing data sets to power its sustainability tech platform or to integrate directly into users’ existing workflows.
Dimension 5 – Explainability
Clarity AI’s VP of Product, Ángel Agudo, Head of Product Research & Innovation, Patricia Pina, Head of Data Strategy, Juan Diego Martin, and Head of Data Science, Ron Potok, discuss – with Chris Ciompi, Clarity AI’s Chief Marketing Officer – the critical dimension of explainability and its relationship to data quality.
Chris Ciompi: Hello again, everyone. Ángel, could you please define explainability in relation to data quality as you see it?
Ángel Agudo: Sure. Explainability is a critical dimension because it provides the ability to understand and trust the data. It’s intrinsically connected to data quality. It means that sometimes we need to provide explanations about the reason for a data point. We may provide information that is qualitative and not necessarily quantitative, which might be easier to understand. For instance, it might be related to why a company is exposed to a specific activity, or why it’s generating a certain policy. It’s essential to find an explanation for why a company is connected to something that might not be apparent at first. Another aspect of explainability is being able to find the source of truth or, in other words, the source for each data point. That way, we can continuously trust and verify the information. We ensure that what we’re presenting is exactly what the company is reporting or providing, or where the data point we’re showing has been used. For example, in a particular news article. Combining all of these aspects contributes to building trust in the data, which is especially important in a context where our clients often lack clarity on ESG data.
Chris Ciompi: I understand. That’s interesting. Before I ask you about trust, Ángel, can you tell me how the Clarity AI platform reveals the single source of truth?
Ángel Agudo: We include links to the reports where the information is disclosed. Users can click on them and access the actual information provided by the company. In cases where the information is not directly provided by the company, but from an external source such as a newspaper or an NGO report, we provide contextual information as well, so they can verify that the source of truth is correct and what we are presenting is exactly what the original source says.
Chris Ciompi: Okay, I see. Patricia, why is explainability important for consumers of sustainability data?
Patricia Pina: Analysts are overwhelmed with information these days, in many cases ESG data has been pushed to them and they don’t fully know what to do with it. The first question they will ask themselves when looking at the data is: where is this data coming from? Why does this company have this score or value for this metric? Unless they understand the information and they trust it they are unlikely to use it in the investment process. Transparency and explainability are therefore key to support the growth of sustainable investing and sustainable products. Furthermore the ESG industry has not lived up to the required level of transparency. As a result, many financial market participants do not understand what ESG data measures and how ESG scores are calculated, which leads to misuse of them and widespread confusion. Not all data and analytics are fit for purpose, each use case and investment strategy will require different information. For example, managing risks derived from ESG factors to maximize risk-adjusted returns of a portfolio is very different from creating impact-driven products that contribute to advancing specific environmental or social objectives.
Chris Ciompi: Thanks. Ron, let’s move on to estimated data. How does Clarity AI explain estimated data?
Ron Potok: It’s crucial to us that we’re transparent about when we’re estimating or imputing data. We make a clear distinction between estimation, imputation, and reported data. We start by revealing our methodology, how we build machine learning models, the features we leverage, and the confidence we have in the estimate. We try to explain all of those features, which is what you care about most. We’re transparent about whether it is estimated or not. We explain what features we’re using, and if these features are reasonable to use. Finally, we explain how well these estimates fit non-reporting companies, on average. All of that is industry-specific, as what you make and where you make it tends to drive a lot of your environmental parameters. We leverage those types of features and are clear about how we use them to build machine learning models. Another important topic about estimates is how often we change estimation models. Some of our competitors retrain their models every quarter, but we attempt to maintain the same model over time. We test it every year to ensure it is still predicting accurately for that year and that the performance has not decreased. We attempt to keep the same model year after year to maintain consistency. New features like if the company acquired a different company or if its revenue or production location changes will give different answers for that year, but we always try to keep the same model.
Chris Ciompi: Juan Diego, how does Clarity AI ensure that its data is explainable?
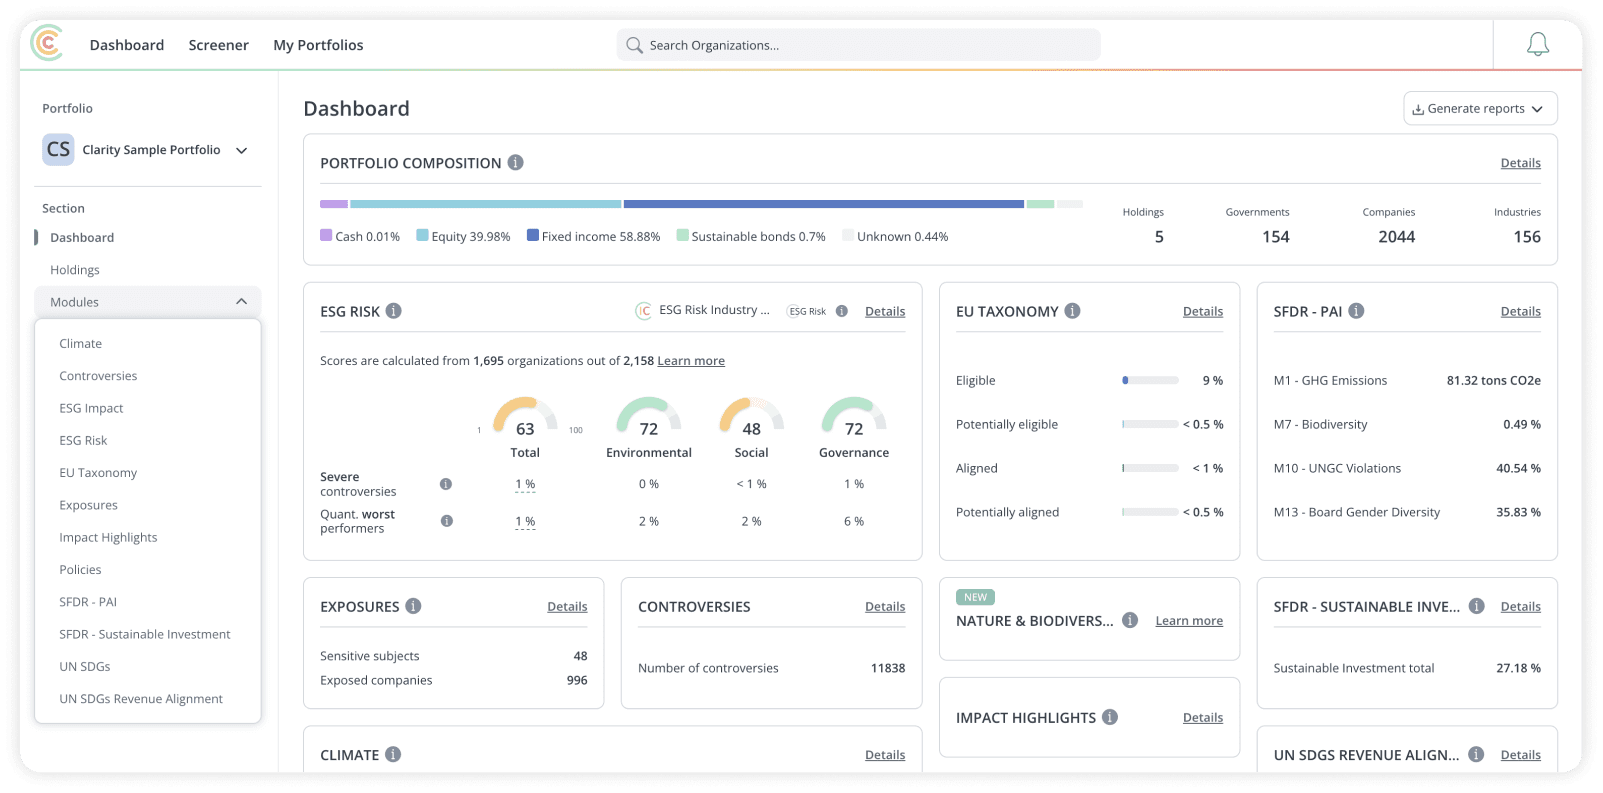
Juan Diego Martín: The key element of explainability is the ability for our users or customers to interrogate the data. We have a very powerful tool which is our user interface, a web application or terminal, and we are very well recognized for offering a superior user experience. Users can interrogate the data to understand how it is built from different methodological perspectives. We explain how the methodology has been developed and used to provide a specific piece of information. We also provide as much raw data as possible, such as the main elements that allowed us to create this score and these data information. The third thing is context on the data, such as where the data has been collected from, the actual content, the report, the specific information that we are using for that, and when the date of the research. We are working on much more features related to explainability that will help users anticipate changes and understand why those changes happen. Basically, it’s about allowing users to ask questions and making the system ready to answer them.
Chris Ciompi: Alright, so a lot of user feedback is what I’m hearing. Is that correct?
Juan Diego Martín: It’s data from users, and for compliance reasons, we cannot always use that information. But of course, the aggregation of the usability aspects is taken into account to improve over time.
Chris Ciompi: Okay, I understand. Okay, Ron, we talked a little bit about estimates already. But are there other ways?
Ron Potok: Yes, we are now leveraging the power of the new generative AI models to give more efficient explanations given the data we have found on companies from their sustainability and/or financial reports, etc. We are using our data in combination with the generative AI technologies to give more color and more efficient explanations of the information we’re trying to provide. This makes sense and seems to be working.
Chris Ciompi: Thanks, everyone!


